Powerful and Intuitive Gaze Analysis Software
EyeLink Data Viewer is a powerful software solution for visualizing and processing gaze data recorded with EyeLink eye trackers. It is available for Windows, macOS, and Linux. Packed with sophisticated features, Data Viewer allows you to visualize, group, process and report EyeLink gaze data with ease.
To find out more about Data Viewer and how it can help your eye-tracking research, please get in touch with us! Data Viewer requires a license key to run, but if you would like to try it, you can run it temporarily in a restricted demo mode without one. You can download the latest version of Data Viewer from our Support Forum by clicking the button below (you will need to be registered with our support forum for the link to work). We also have a number of video tutorials to help you get started with Data Viewer:
Easy to Use
A straightforward interface with multiple configurable panels and windows allows gaze data from multiple EyeLink data files to be grouped, visualized, and processed.
Multiple Visualization Options
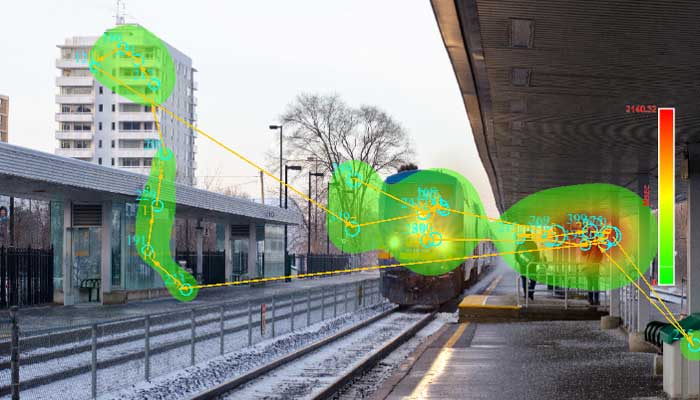
The Spatial Overlay View allows saccades and fixations to be superimposed over trial graphics and used for heat map and interest area creation.
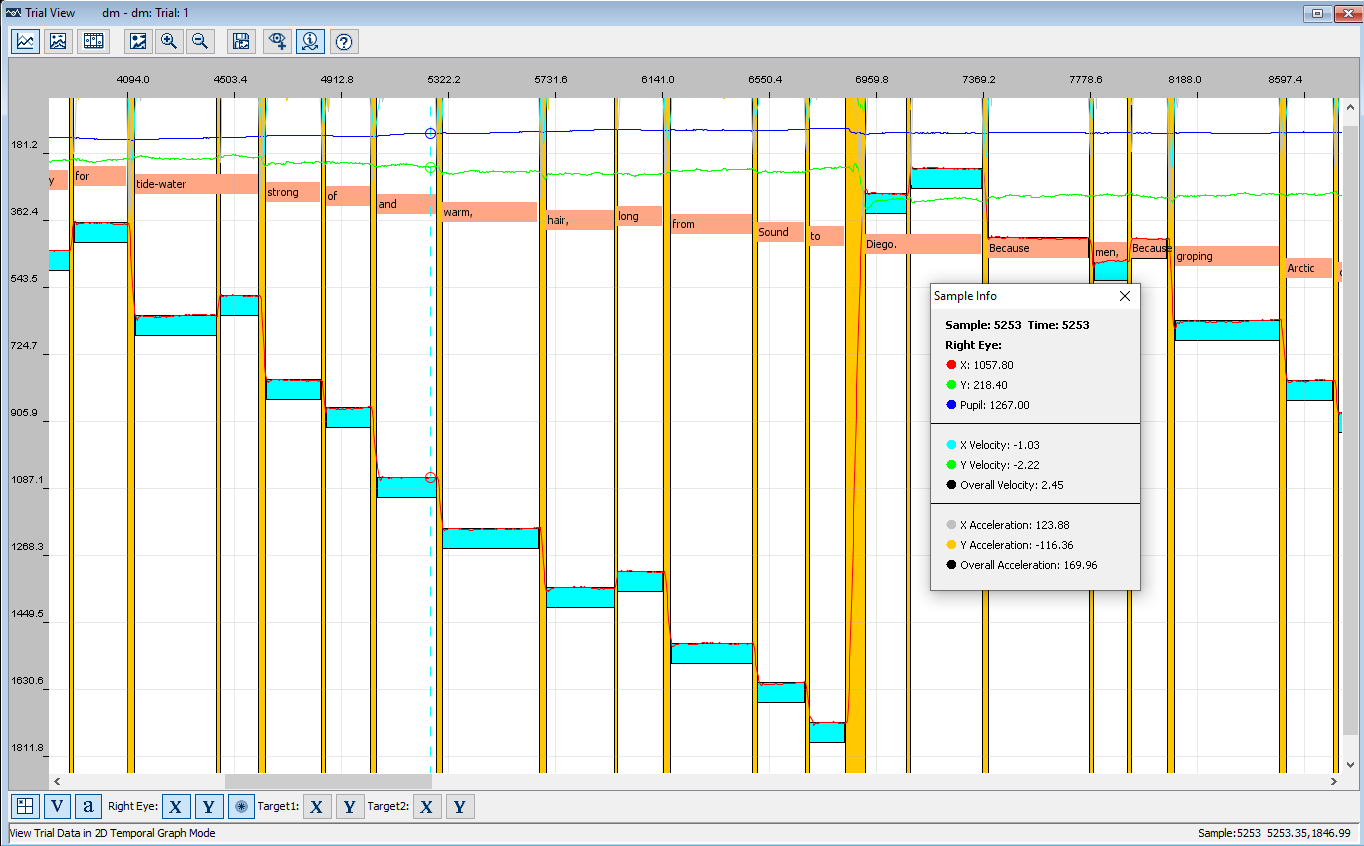
Gaze and pupil data can be plotted over time with the Temporal Graph View, and individual events selected and adjusted.
Trials can be played back in the Animated Playback View, which allows for beeswarm animations and dynamic heatmaps. Playback view also supports the creation of dynamic interest areas.
Group / Filter Data
Data Viewer is designed to process multiple data files simultaneously. Data can be grouped by one or more experimental variables, and each group’s data can be individually color-coded, allowing for straightforward comparisons between experimental conditions. Aggregate Data Mode allows users to simultaneously view eye-tracking data from multiple participants/trials. Interest Periods can be created to isolate and align specific time windows across trials. Finally, trial grouping enables data to be filtered, based on trial variables such as accuracy, and included / excluded from subsequent processing and reports.

Generate Powerful Reports
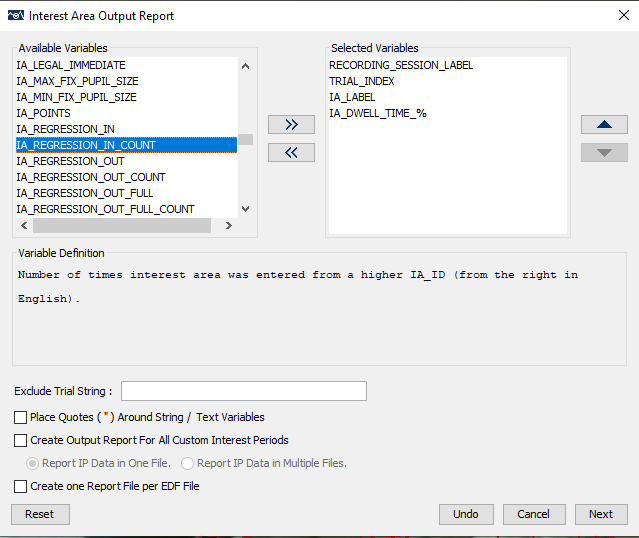
Data Viewer allows reports to be generated at the Trial, Interest Area, Fixation, Saccade, and even Sample level. Time Series (binning) reports can be generated for Visual World and related tasks with just a few clicks. Aggregate Event and Aggregate Interest Area reports allow for a rapid overview of key gaze metrics, collapsed over trial grouping variables. Each output report provides a wide range of gaze data variables that can be individually selected, including many standard “reading measures” such as regression count and first-run dwell time. All Data Viewer reports can be imported directly into Excel or statistical analysis packages such as SPSS and R for further processing.
Data Viewer Integration Protocol
Data Viewer integrates seamlessly with both Experiment Builder and WebLink, but its simple message-based integration protocol allows researchers to create tasks with other popular stimulus presentation software solutions. The resulting data files will contain all the information required to support Data Viewer’s powerful visualization, grouping, and analysis features.